We use cookies to understand how you use our site and to improve your experience.
This includes personalizing content and advertising.
By pressing "Accept All" or closing out of this banner, you consent to the use of all cookies and similar technologies and the sharing of information they collect with third parties.
You can reject marketing cookies by pressing "Deny Optional," but we still use essential, performance, and functional cookies.
In addition, whether you "Accept All," Deny Optional," click the X or otherwise continue to use the site, you accept our Privacy Policy and Terms of Service, revised from time to time.
You are being directed to ZacksTrade, a division of LBMZ Securities and licensed broker-dealer. ZacksTrade and Zacks.com are separate companies. The web link between the two companies is not a solicitation or offer to invest in a particular security or type of security. ZacksTrade does not endorse or adopt any particular investment strategy, any analyst opinion/rating/report or any approach to evaluating individual securities.
If you wish to go to ZacksTrade, click OK. If you do not, click Cancel.
Biotech stocks combine scientific innovation with substantial R&D investment in cutting edge medicine.
Biotech sector includes companies focused on gene editing and breakthroughs in rare disease treatment.
Biotech stocks are higher risk, but with higher potential for reward for companies that succeed.
The biotech sector continues to draw intense investor interest — from innovation in gene editing and mRNA to breakthroughs in rare disease therapies. But with high risk comes high reward, and separating long-term winners from speculative bets is more important than ever.
Are Biotech Stocks a Good Investment Long-Term?
Biotech companies can deliver extraordinary upside when their clinical programs succeed — but the path is fraught. Long-term investing in biotech often hinges on believing in a company’s pipeline, cash runway and capacity to navigate regulatory hurdles. Many top biotechs have matured past early-stage risk, with commercial revenues and established R&D engines, making them more resilient in volatile markets.
Meanwhile, broader trends like aging populations, precision medicine, and platform technologies (like gene therapy and mRNA) bolster the long-term case. However, interest rate swings, clinical failures and capital burn remain real threats. For investors with sufficient time horizon and risk tolerance, biotechs offer a compelling opportunity.
Here, we analyze and rank the best biotech stocks to buy now ranked on a blend Zacks Rank signals, Style Scores and fundamentals:
This is our short term rating system that serves as a timeliness indicator for stocks over the next 1 to 3 months. How good is it? See rankings and related performance below.
The Zacks Industry Rank assigns a rating to each of the 265 X (Expanded) Industries based on their average Zacks Rank.
An industry with a larger percentage of Zacks Rank #1's and #2's will have a better average Zacks Rank than one with a larger percentage of Zacks Rank #4's and #5's.
The industry with the best average Zacks Rank would be considered the top industry (1 out of 265), which would place it in the top 1% of Zacks Ranked Industries. The industry with the worst average Zacks Rank (265 out of 265) would place in the bottom 1%.
The Zacks Sector Rank assigns a rating to each of the 16 Sectors based on their average Zacks Rank.
A sector with a larger percentage of Zacks Rank #1's and #2's will have a better average Zacks Rank than one with a larger percentage of Zacks Rank #4's and #5's.
The sector with the best average Zacks Rank would be considered the top sector (1 out of 16), which would place it in the top 1% of Zacks Ranked Sectors. The sector with the worst average Zacks Rank (16 out of 16) would place in the bottom 1%.
The Style Scores are a complementary set of indicators to use alongside the Zacks Rank. It allows the user to better focus on the stocks that are the best fit for his or her personal trading style.
The scores are based on the trading styles of Value, Growth, and Momentum. There's also a VGM Score ('V' for Value, 'G' for Growth and 'M' for Momentum), which combines the weighted average of the individual style scores into one score.
Value ScoreA
Growth ScoreA
Momentum ScoreA
VGM ScoreA
Within each Score, stocks are graded into five groups: A, B, C, D and F. As you might remember from your school days, an A, is better than a B; a B is better than a C; a C is better than a D; and a D is better than an F.
As an investor, you want to buy stocks with the highest probability of success. That means you want to buy stocks with a Zacks Rank #1 or #2, Strong Buy or Buy, which also has a Score of an A or a B in your personal trading style.
Zacks Earnings ESP (Expected Surprise Prediction) looks to find companies that have recently seen positive earnings estimate revision activity. The idea is that more recent information is, generally speaking, more accurate and can be a better predictor of the future, which can give investors an advantage in earnings season.
The technique has proven to be very useful for finding positive surprises. In fact, when combining a Zacks Rank #3 or better and a positive Earnings ESP, stocks produced a positive surprise 70% of the time, while they also saw 28.3% annual returns on average, according to our 10 year backtest.
GRAIL is a cancer diagnostics company whose Galleri blood test seeks to detect multiple cancers before symptoms appear. Its appeal lies in creating a new screening category rather than competing only within established testing markets. Employer coverage, health-plan adoption, electronic-record integration and stronger evidence could move Galleri toward routine use.
Potential Risks
The model still depends on proving that earlier detection changes outcomes and justifies broad coverage. Regulatory delays, slower physician adoption, weak study results or sustained cash burn could undermine confidence and increase dilution risk.
Forecast
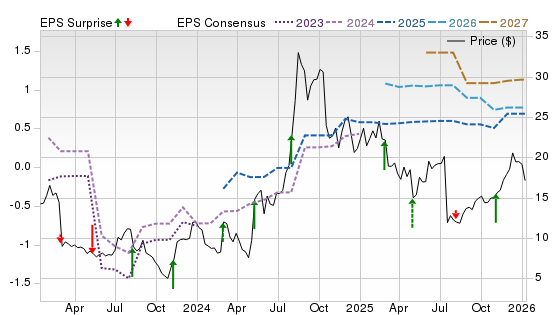
A Zacks Rank #2 (Buy) supports a favorable near-term view, but a Value Score of F, Growth Score of D and Momentum Score of C reveal limited factor support. The Price, Consensus & EPS Surprise chart shows a volatile price recovery, broadly stable forward estimates and uneven earnings surprises. That pattern suggests future returns will hinge more on clinical validation and reimbursement progress than on predictable earnings expansion.
This is our short term rating system that serves as a timeliness indicator for stocks over the next 1 to 3 months. How good is it? See rankings and related performance below.
The Zacks Industry Rank assigns a rating to each of the 265 X (Expanded) Industries based on their average Zacks Rank.
An industry with a larger percentage of Zacks Rank #1's and #2's will have a better average Zacks Rank than one with a larger percentage of Zacks Rank #4's and #5's.
The industry with the best average Zacks Rank would be considered the top industry (1 out of 265), which would place it in the top 1% of Zacks Ranked Industries. The industry with the worst average Zacks Rank (265 out of 265) would place in the bottom 1%.
The Zacks Sector Rank assigns a rating to each of the 16 Sectors based on their average Zacks Rank.
A sector with a larger percentage of Zacks Rank #1's and #2's will have a better average Zacks Rank than one with a larger percentage of Zacks Rank #4's and #5's.
The sector with the best average Zacks Rank would be considered the top sector (1 out of 16), which would place it in the top 1% of Zacks Ranked Sectors. The sector with the worst average Zacks Rank (16 out of 16) would place in the bottom 1%.
The Style Scores are a complementary set of indicators to use alongside the Zacks Rank. It allows the user to better focus on the stocks that are the best fit for his or her personal trading style.
The scores are based on the trading styles of Value, Growth, and Momentum. There's also a VGM Score ('V' for Value, 'G' for Growth and 'M' for Momentum), which combines the weighted average of the individual style scores into one score.
Value ScoreA
Growth ScoreA
Momentum ScoreA
VGM ScoreA
Within each Score, stocks are graded into five groups: A, B, C, D and F. As you might remember from your school days, an A, is better than a B; a B is better than a C; a C is better than a D; and a D is better than an F.
As an investor, you want to buy stocks with the highest probability of success. That means you want to buy stocks with a Zacks Rank #1 or #2, Strong Buy or Buy, which also has a Score of an A or a B in your personal trading style.
Zacks Earnings ESP (Expected Surprise Prediction) looks to find companies that have recently seen positive earnings estimate revision activity. The idea is that more recent information is, generally speaking, more accurate and can be a better predictor of the future, which can give investors an advantage in earnings season.
The technique has proven to be very useful for finding positive surprises. In fact, when combining a Zacks Rank #3 or better and a positive Earnings ESP, stocks produced a positive surprise 70% of the time, while they also saw 28.3% annual returns on average, according to our 10 year backtest.
Tango Therapeutics develops precision oncology drugs for cancers driven by specific genetic vulnerabilities. The investment case centers on whether vopimetostat can convert encouraging early combination data into a broader development path. Readouts across MTAP-deleted tumors could show utility beyond one cancer type, while an extended cash runway gives management room to pursue those trials without immediate financing pressure. Success would materially expand the company’s strategic value.
Potential Risks
The evidence remains preliminary, patient groups are small and durability is still uncertain. Safety concerns, slower enrollment, weaker later-stage efficacy or advances by rival PRMT5 and RAS programs could sharply reduce expectations.
Forecast
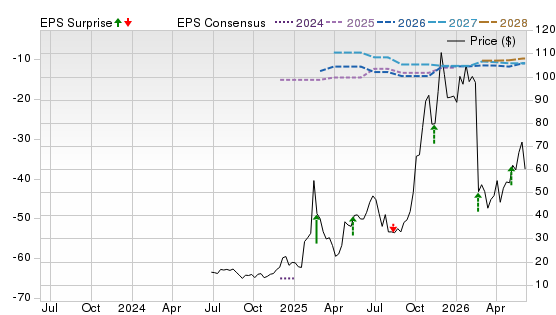
A Zacks Rank #2 points to constructive estimate revisions, though a Value Score of F, Growth Score of F and Momentum Score of C confirm a highly speculative profile. The chart shows a rebound from depressed levels, softer forward estimates and inconsistent surprise markers. Clinical execution therefore matters far more than conventional earnings momentum.
This is our short term rating system that serves as a timeliness indicator for stocks over the next 1 to 3 months. How good is it? See rankings and related performance below.
The Zacks Industry Rank assigns a rating to each of the 265 X (Expanded) Industries based on their average Zacks Rank.
An industry with a larger percentage of Zacks Rank #1's and #2's will have a better average Zacks Rank than one with a larger percentage of Zacks Rank #4's and #5's.
The industry with the best average Zacks Rank would be considered the top industry (1 out of 265), which would place it in the top 1% of Zacks Ranked Industries. The industry with the worst average Zacks Rank (265 out of 265) would place in the bottom 1%.
The Zacks Sector Rank assigns a rating to each of the 16 Sectors based on their average Zacks Rank.
A sector with a larger percentage of Zacks Rank #1's and #2's will have a better average Zacks Rank than one with a larger percentage of Zacks Rank #4's and #5's.
The sector with the best average Zacks Rank would be considered the top sector (1 out of 16), which would place it in the top 1% of Zacks Ranked Sectors. The sector with the worst average Zacks Rank (16 out of 16) would place in the bottom 1%.
The Style Scores are a complementary set of indicators to use alongside the Zacks Rank. It allows the user to better focus on the stocks that are the best fit for his or her personal trading style.
The scores are based on the trading styles of Value, Growth, and Momentum. There's also a VGM Score ('V' for Value, 'G' for Growth and 'M' for Momentum), which combines the weighted average of the individual style scores into one score.
Value ScoreA
Growth ScoreA
Momentum ScoreA
VGM ScoreA
Within each Score, stocks are graded into five groups: A, B, C, D and F. As you might remember from your school days, an A, is better than a B; a B is better than a C; a C is better than a D; and a D is better than an F.
As an investor, you want to buy stocks with the highest probability of success. That means you want to buy stocks with a Zacks Rank #1 or #2, Strong Buy or Buy, which also has a Score of an A or a B in your personal trading style.
Zacks Earnings ESP (Expected Surprise Prediction) looks to find companies that have recently seen positive earnings estimate revision activity. The idea is that more recent information is, generally speaking, more accurate and can be a better predictor of the future, which can give investors an advantage in earnings season.
The technique has proven to be very useful for finding positive surprises. In fact, when combining a Zacks Rank #3 or better and a positive Earnings ESP, stocks produced a positive surprise 70% of the time, while they also saw 28.3% annual returns on average, according to our 10 year backtest.
Arcutis Biotherapeutics is an immunodermatology company building ZORYVE into a multi-indication topical franchise. The opportunity extends beyond one launch. Pediatric approvals, broader prescribing and new formulations can widen the market while reusing one commercial platform across several skin disorders. That model offers operating leverage, and upcoming regulatory decisions could add new growth lanes without requiring an entirely separate sales infrastructure.
Potential Risks
ZORYVE concentration exposes Arcutis to payer restrictions, slower prescriptions and competition. Elevated spending or setbacks in label expansion, safety or reimbursement could pressure its growth premium.
Forecast
A Zacks Rank #2 and Growth Score of A point to strong earnings expansion potential, while a Value Score of D and Momentum Score of D temper the signal. The chart shows a powerful longer-term advance, recent volatility, rising forward estimates and mostly positive surprises. Continued upside depends on turning new indications into durable demand rather than relying on approval headlines alone.
This is our short term rating system that serves as a timeliness indicator for stocks over the next 1 to 3 months. How good is it? See rankings and related performance below.
The Zacks Industry Rank assigns a rating to each of the 265 X (Expanded) Industries based on their average Zacks Rank.
An industry with a larger percentage of Zacks Rank #1's and #2's will have a better average Zacks Rank than one with a larger percentage of Zacks Rank #4's and #5's.
The industry with the best average Zacks Rank would be considered the top industry (1 out of 265), which would place it in the top 1% of Zacks Ranked Industries. The industry with the worst average Zacks Rank (265 out of 265) would place in the bottom 1%.
The Zacks Sector Rank assigns a rating to each of the 16 Sectors based on their average Zacks Rank.
A sector with a larger percentage of Zacks Rank #1's and #2's will have a better average Zacks Rank than one with a larger percentage of Zacks Rank #4's and #5's.
The sector with the best average Zacks Rank would be considered the top sector (1 out of 16), which would place it in the top 1% of Zacks Ranked Sectors. The sector with the worst average Zacks Rank (16 out of 16) would place in the bottom 1%.
The Style Scores are a complementary set of indicators to use alongside the Zacks Rank. It allows the user to better focus on the stocks that are the best fit for his or her personal trading style.
The scores are based on the trading styles of Value, Growth, and Momentum. There's also a VGM Score ('V' for Value, 'G' for Growth and 'M' for Momentum), which combines the weighted average of the individual style scores into one score.
Value ScoreA
Growth ScoreA
Momentum ScoreA
VGM ScoreA
Within each Score, stocks are graded into five groups: A, B, C, D and F. As you might remember from your school days, an A, is better than a B; a B is better than a C; a C is better than a D; and a D is better than an F.
As an investor, you want to buy stocks with the highest probability of success. That means you want to buy stocks with a Zacks Rank #1 or #2, Strong Buy or Buy, which also has a Score of an A or a B in your personal trading style.
Zacks Earnings ESP (Expected Surprise Prediction) looks to find companies that have recently seen positive earnings estimate revision activity. The idea is that more recent information is, generally speaking, more accurate and can be a better predictor of the future, which can give investors an advantage in earnings season.
The technique has proven to be very useful for finding positive surprises. In fact, when combining a Zacks Rank #3 or better and a positive Earnings ESP, stocks produced a positive surprise 70% of the time, while they also saw 28.3% annual returns on average, according to our 10 year backtest.
Neurocrine Biosciences develops therapies for neurological and endocrine disorders, with INGREZZA funding a broader portfolio. The forward case rests on deeper penetration in tardive dyskinesia, continued CRENESSITY adoption and diversification through VYKAT XR after the Soleno acquisition. Those assets can reduce dependence on one franchise and create multiple earnings drivers. The pipeline adds optionality without making the thesis hinge on one binary event.
Potential Risks
INGREZZA remains the principal profit engine, leaving Neurocrine exposed to payer pressure, patent challenges and slower patient additions. Integrating Soleno, scaling newer launches and funding more programs could weigh on margins.
Forecast
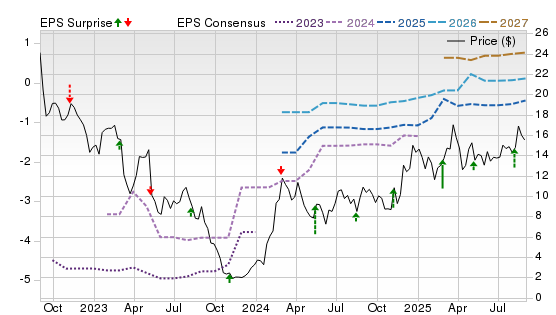
A Zacks Rank #2, Value Score of B and Growth Score of A suggest an attractive blend of valuation and expansion potential. The Momentum Score of F indicates weak price follow-through. Even so, the chart shows sharply higher forward estimates and predominantly positive surprises, implying that sustained commercial execution could eventually pull market sentiment closer to fundamentals.
This is our short term rating system that serves as a timeliness indicator for stocks over the next 1 to 3 months. How good is it? See rankings and related performance below.
The Zacks Industry Rank assigns a rating to each of the 265 X (Expanded) Industries based on their average Zacks Rank.
An industry with a larger percentage of Zacks Rank #1's and #2's will have a better average Zacks Rank than one with a larger percentage of Zacks Rank #4's and #5's.
The industry with the best average Zacks Rank would be considered the top industry (1 out of 265), which would place it in the top 1% of Zacks Ranked Industries. The industry with the worst average Zacks Rank (265 out of 265) would place in the bottom 1%.
The Zacks Sector Rank assigns a rating to each of the 16 Sectors based on their average Zacks Rank.
A sector with a larger percentage of Zacks Rank #1's and #2's will have a better average Zacks Rank than one with a larger percentage of Zacks Rank #4's and #5's.
The sector with the best average Zacks Rank would be considered the top sector (1 out of 16), which would place it in the top 1% of Zacks Ranked Sectors. The sector with the worst average Zacks Rank (16 out of 16) would place in the bottom 1%.
The Style Scores are a complementary set of indicators to use alongside the Zacks Rank. It allows the user to better focus on the stocks that are the best fit for his or her personal trading style.
The scores are based on the trading styles of Value, Growth, and Momentum. There's also a VGM Score ('V' for Value, 'G' for Growth and 'M' for Momentum), which combines the weighted average of the individual style scores into one score.
Value ScoreA
Growth ScoreA
Momentum ScoreA
VGM ScoreA
Within each Score, stocks are graded into five groups: A, B, C, D and F. As you might remember from your school days, an A, is better than a B; a B is better than a C; a C is better than a D; and a D is better than an F.
As an investor, you want to buy stocks with the highest probability of success. That means you want to buy stocks with a Zacks Rank #1 or #2, Strong Buy or Buy, which also has a Score of an A or a B in your personal trading style.
Zacks Earnings ESP (Expected Surprise Prediction) looks to find companies that have recently seen positive earnings estimate revision activity. The idea is that more recent information is, generally speaking, more accurate and can be a better predictor of the future, which can give investors an advantage in earnings season.
The technique has proven to be very useful for finding positive surprises. In fact, when combining a Zacks Rank #3 or better and a positive Earnings ESP, stocks produced a positive surprise 70% of the time, while they also saw 28.3% annual returns on average, according to our 10 year backtest.
CareDx provides molecular diagnostics and digital tools for transplant care, oncology and cell therapy. Its appeal comes from repositioning around higher-value testing. Naveris adds a reimbursed residual-disease platform and faster-growing oncology exposure, while the Lab Products divestiture frees capital and removes a lower-priority operation. Cross-selling, tighter focus and better mix could support stronger margins and a more durable growth profile.
Potential Risks
Integration is the central challenge. CareDx must absorb Naveris, preserve transplant growth and deliver expected synergies without disrupting service quality. Reimbursement changes, coverage disputes, litigation or weaker collection trends could reduce earnings visibility and pressure valuation.
Forecast
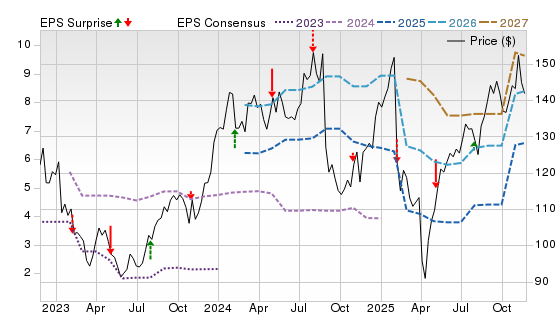
A Zacks Rank #3 (Hold), alongside a Growth Score of A, Momentum Score of B and VGM Score of B, signals improving market trends. The Value Score of D offers limited valuation support. The chart shows a strong price recovery, volatile upward estimates and mostly favorable surprises. This supports selective upside, though execution must justify the rerating.
The Zacks Rank is a proprietary stock-rating model that uses trends in earnings estimate revisions and earnings-per-share (EPS) surprises to classify stocks into five groups: #1 (Strong Buy), #2 (Buy), #3 (Hold), #4 (Sell) and #5 (Strong Sell). The Zacks Rank is calculated through four primary factors related to earnings estimates: analysts' consensus on earnings estimate revisions, the magnitude of revision change, the upside potential and estimate surprise (or the degree in which earnings per share deviated from the previous quarter).
Zacks builds the data from 3,000 analysts at over 150 different brokerage firms. The average yearly gain for Zacks Rank #1 (Strong Buy) stocks is +23.94% per year from January, 1988, through July 6, 2026.
Selections for Best Biotech Stocks are based on the current top ranking stocks based on Zacks Indicator Score, Style Scores and fundamentals. For this list, only companies that have average daily trading volumes of 100,000 shares or more of 135 biotech companies listed on the New York Stock Exchange or Nasdaq. All information is current as of market open, July 30, 2026.
General Biotech Investment Questions
What Are Biotech Stocks?
Biotech stocks are shares of companies that use biological systems and organisms to develop new drugs, therapies, and diagnostics. These firms invest heavily in research & development and often carry greater risk than traditional pharmaceutical companies.
Therapeutic biotechs: Develop specific drug candidates (e.g., rare disease, oncology).
Service biotechs: Provide research tools, reagents, or contract research services.
What Are the Benefits of Buying Biotech Stocks?
High upside: Successful trials or approvals can lead to big gains.
Innovative exposure: Access to cutting-edge science (e.g., gene therapy).
Diversification: Biotech can be a non-cyclical growth lever in a portfolio.
Partnering potential: Smaller biotech firms are often acquired by larger pharma.
What Are the Risks of Buying Biotech Stocks?
Clinical risk: Many drugs fail in trials
Cash burn: R&D is expensive, and many biotechs depend on funding.
Regulatory risk: FDA decisions can make or break a company.
Volatility: Stock prices swing wildly on news.
Biotech Stocks vs. Biotech ETFs
Stocks: Higher potential reward, but higher risk and volatility
ETFs: Diversified exposure, smoother ride, less binary outcomes
Which is right depends on your risk tolerance and conviction in individual companies.
Why Are Biotech Stocks So Volatile?
Clinical trial outcomes are binary (success/failure).
Regulatory approvals depend on strict criteria.
Biotechs often raise capital, diluting shareholders.
News-driven: trial results, partnership deals, or FDA news can swing sentiment.
Is It Too Late to Invest in Biotech Stocks?
Not necessarily. While some biotechs (especially large-caps) may look fully valued, many smaller, clinical-stage companies still offer asymmetric upside. Plus, emerging trends — gene editing, synthetic biology, AI-driven drug discovery — continue to open new frontiers.
Best Biotech ETFs
Not all investors want to take on the risk of single biotechs. Below are some top ETFs that offer diversified exposure:
iShares Biotechnology ETF (IBB): Focuses on large-cap biotech names, offering lower volatility compared to smaller biotechs.
SPDR S&P Biotech ETF (XBI): Equal-weighted, which means more exposure to mid- and small-cap biotech companies — higher risk, potentially higher reward.
VanEck Biotech ETF (BBH): Concentrated in major pure-play biotech names.
These ETFs help mitigate the binary risk inherent in individual biotech names by spreading exposure across many companies.
Biotech Stocks Trends and Forecast
What Biotech Stocks Could Benefit from New FDA Approvals?
Sarepta (SRPT): Pipeline in DMD and other neuromuscular disorders.
Beam (BEAM): Base-editing therapies could attract regulatory attention as clinical data matures.
Arcellx: Its CAR-T programs (e.g., anito-cel) could hit registrational milestones soon.
Which Biotech Firms Are Leading in Gene Editing or mRNA?
What Are the Most Promising Biotech Trends for 2025/2026?
Base editing and next-gen CRISPR.
Synthetic biology for therapeutics.
Precision medicine for rare diseases.
AI-driven drug discovery.
Cell and gene therapies for “undruggable” conditions.
How Does Interest Rate Policy Affect Biotech Valuations?
Higher interest rates make future cash flows less valuable, which disproportionately affects pre-commercial biotech companies. Biotechs with strong cash reserves, recurring revenues, or partnerships may weather a high-rate environment better than early-stage names.
What Startups Could Be the Next Big Biotech Breakout?
Some emerging companies to watch include those in base editing (like Beam) or synthetic biology (like Twist Bioscience). Also, small gene therapy firms that prove safety and efficacy could be acquisition targets.
How to Select Biotech Stocks
How to Evaluate a Biotech Company’s Pipeline
Examine clinical trial phases and data (Phase 1–3).
Check regulatory designations (Orphan, Fast Track, Breakthrough).
Assess manufacturing strategy (can they scale?)
Review partnerships with big pharma.
What Financial Metrics Should I Look at When Selecting Biotech Stocks?
Cash runway — Months until they need to raise capital.
Burn rate — How fast they spend R&D cash?
Debt levels — To help understand leverage risk.
Revenue sources — If any (e.g., royalties, partnerships).
Valuation multiples — P/E for commercial companies, or price-to-cash for R&D firms.
Which Biotech Companies Are Using AI for Drug Discovery?
Several biotech firms now leverage AI to speed up target identification, optimize molecules, and predict clinical success. While specific names vary, more platform-focused biotechs (especially in synthetic biology and precision medicine) are adopting AI broadly.
Advanced or Thematic Biotech Investing
Best Gene Therapy, Immunotherapy, or Synthetic Biology Stocks
Companies combining AI with biology to accelerate drug development are particularly exciting. Though many remain private, public players using AI in drug discovery or platform development may include synthetic biology firms and next-gen therapeutic companies.
Small-Cap vs. Large-Cap Biotech Investing Strategies
Small-Cap: Higher risk/reward; ideal for speculative, event-driven plays.
Large-Cap: More stability, some revenue streams, diversified pipelines.
Balanced Approach: Use ETFs for broad exposure + pick 1–2 individual names for high conviction.
How FDA Approval Cycles Impact Biotech Valuations
Each clinical milestone (Phase 2 readout, Phase 3 initiation, NDA/BLA filing) can trigger major revaluations. Investors often build models around key FDA dates, trial data, and partner commitments. Failure or delay can lead to steep losses; success can lead to multi-bagger returns.




 View the Zacks #1 Rank List


 Buy
Buy 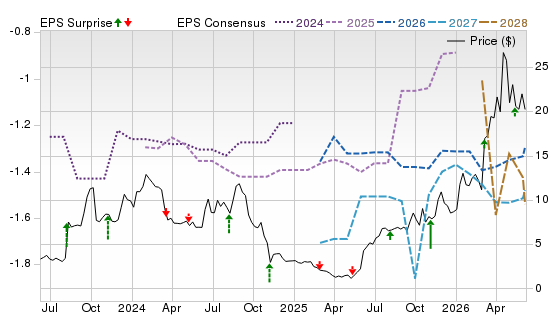
 Buy
Buy